pp. 11 & 12
A good example of a substituted cyclohexane system is methylcyclohexane. As the picture below reveals, when the methyl group is straight up and down (the axial position) it is very close to the axial hydrogens and may encounter electron repulsion and steric hindrance. This interaction is called a 1,3-Diaxial Interaction and raises the energy of the axial conformer by approximately 1.8 kcal/mole. The chair can “flip” placing the methyl group equatorial where it is seen that the electron repulsion and steric hindrance have been greatly reduced. In a steric sense, substituents are much more stable in the equatorial position than in the axial position.

One of the difficulties many students encounter in organic chemistry is being able properly conduct a “chair-flip” of a cyclohexane molecule. Most students rotate and do not actually chair-flip, a mistake that often leads to an incorrect answer. The movie below illustrates how to properly view methylcyclohexane and how to properly conduct a chair flip to arrive at the correct conclusion when looking at differing conformations.
(For a larger version of this movie, please click here)
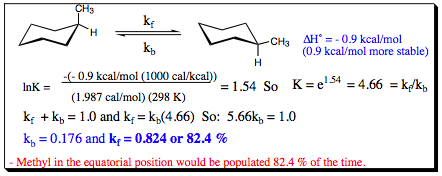
As was shown with acyclic conformers, the relative populations and energies of conformational isomers may be determined using the Arrhenius Equation. The population states for axial and equatorial methyl cyclohexane are shown below:
These style of experiments have been conducted for a large body of substituted cyclohexane systems and allows susbstituents to be assigned A-Values. An A-Value given to a substituent is based on its propensity to reside in the equatorial rather than the axial position. The higher the A-Value, the more likely a substituent is to reside in the equatorial position in lieu of the axial position. A listing of substituents and their A-Values is shown below:

It is interesting to note that methyl, ethyl, and isopropyl groups have very similar A-values while the t-butyl group has a much larger A-value. A look at the picture on the following page will help to explain this phenomenon.
| PREVIOUS PAGE (9 & 10) | Back to Index | NEXT PAGE (13 & 14) |